Title
How to set adaptive y-axis range for line chart?
Problem Description
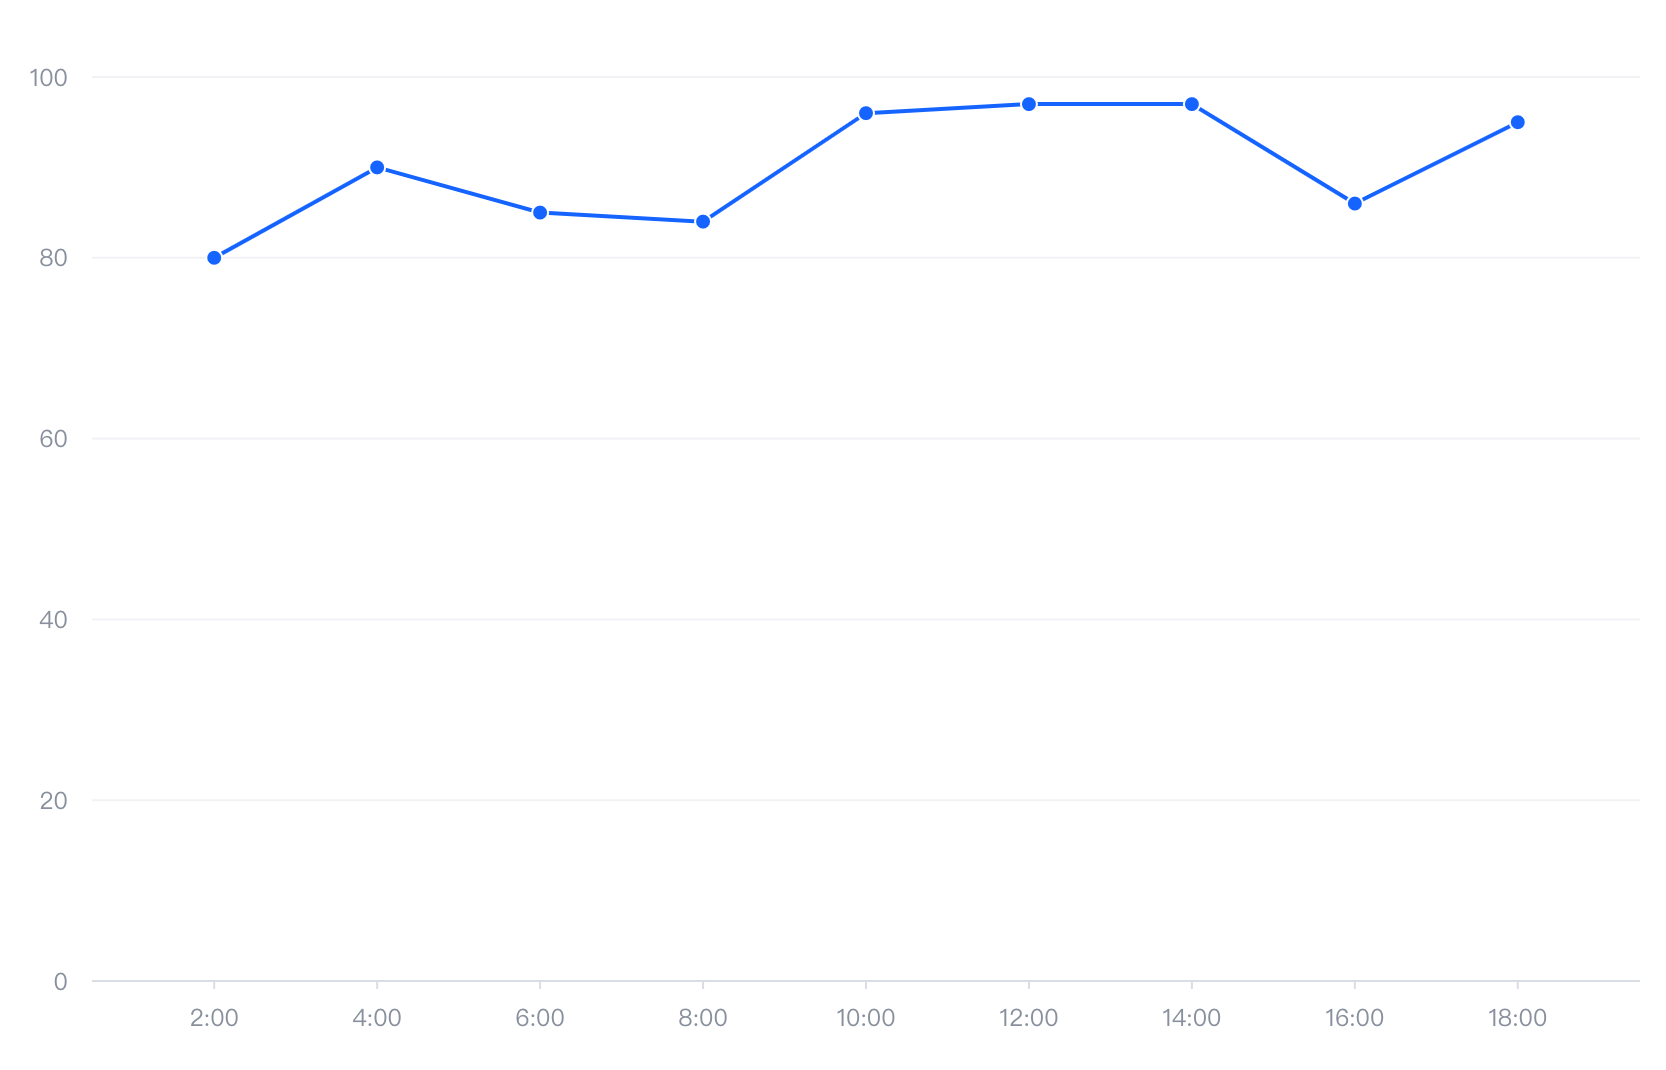
As shown in the figure below, the data range of my line chart is between 80-100. How can I set it so that the Y-axis range can adapt to the range of this data?

Solution
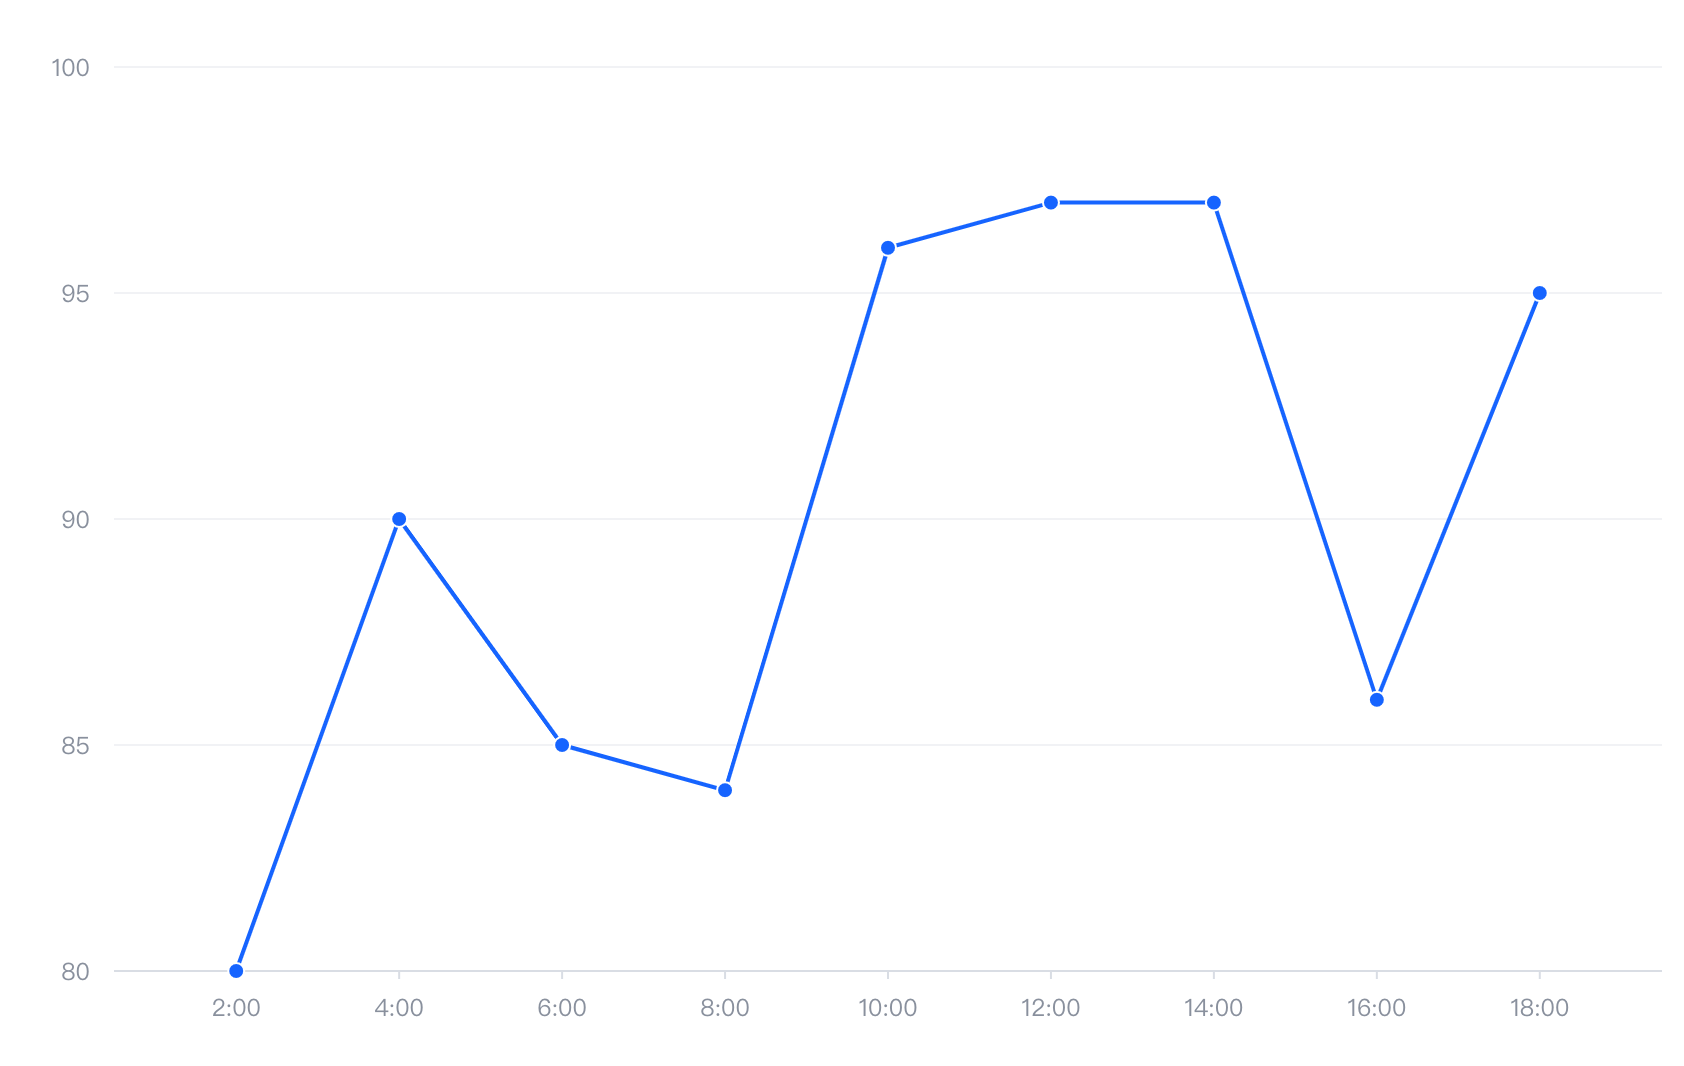
By default, zero is configured as true for continuous axes, and the axis range will default to starting from the 0 value. If you want the range of the continuous axis to adapt to the data range, you can turn off this configuration item:
  axes: [
    { orient: 'left', zero: false },
  ]</br>
Code Example
const spec = {
  type: 'line',
  data: {
    values: [
      {
        time: '2:00',
        value: 80
      },
      {
        time: '4:00',
        value: 90
      },
      {
        time: '6:00',
        value: 85
      },
      {
        time: '8:00',
        value: 84
      },
      {
        time: '10:00',
        value: 96
      },
      {
        time: '12:00',
        value: 97
      },
      {
        time: '14:00',
        value: 97
      },
      {
        time: '16:00',
        value: 86
      },
      {
        time: '18:00',
        value: 95
      }
    ]
  },
  xField: 'time',
  yField: 'value',
  axes: [
    { orient: 'left', zero: false },
  ]
};

const vchart = new VChart(spec, { dom: CONTAINER_ID });
vchart.renderSync();

// Just for the convenience of console debugging, DO NOT COPY!
window['vchart'] = vchart;</br>
Results

